
A high PageSpeed score and a slow website can coexist. The score summarizes a loading test; visitors also open menus, fill in forms, and wait for responses. Before adding a plugin or changing hosts, identify when the slowdown occurs.
Separate three questions: page or origin, lab or real users, loading or interaction. Our Web development and performance section connects those observations to decisions you can verify.
Table of Contents
What the score and field data actually tell you
The performance score summarizes one Lighthouse run. It helps locate issues and compare tests under similar conditions. Network, content, and test environment all affect the result, so record the metrics and conditions as well as the score.
Real user data comes from CrUX over a rolling 28-day window. Check whether the report describes the specific URL or the origin. When a page lacks enough samples, PageSpeed may show origin data instead; if neither has data, there is no field assessment. Missing data is neither a pass nor a fail.
The Core Web Vitals are LCP, INP, and CLS. At the 75th percentile, the good thresholds are 2.5 seconds, 200 milliseconds, and 0.1 or less, respectively. The percentile is not an average. Look at the distribution, which can hide worse experiences behind an aggregate result.
Google’s PageSpeed Insights documentation explains what the score and field data cover. Use those definitions before comparing unlike reports.
Find when the page actually feels slow
Is the main content late to appear? Investigate loading. Does a menu lag after the page is visible? Reproduce the click. Does search respond to a tap but take too long to return results? Measure the request and the completed task. Each symptom calls for a different investigation.
INP measures the visual response to clicks, taps, and keystrokes. It does not, by itself, cover the full duration of an asynchronous operation. A loading indicator can appear quickly while the server response takes time; measure that wait too.
A low TBT during initial loading does not rule out slow interactions later. Record the action, device, and conditions. Let field data guide reproduction; without it, test the page’s common tasks.
The web.dev guide to slow interactions shows how to record a flow and compare it with available field data.
A real example from this production site
On November 1, 2026, at 00:48 CET, an online test of this blog’s llms.txt article returned a mobile performance score of 99. The report used Lighthouse 13.6.0, an emulated Moto G Power, and slow 4G throttling. It was one initial loading run, not a study of visitors.
The run reported LCP of 1.1 seconds, TBT of 0 ms, and CLS of 0.053. The real user section said “No hay datos.” Lab numbers were good in that run, but field data is missing, so the visitor experience cannot be assessed from it.
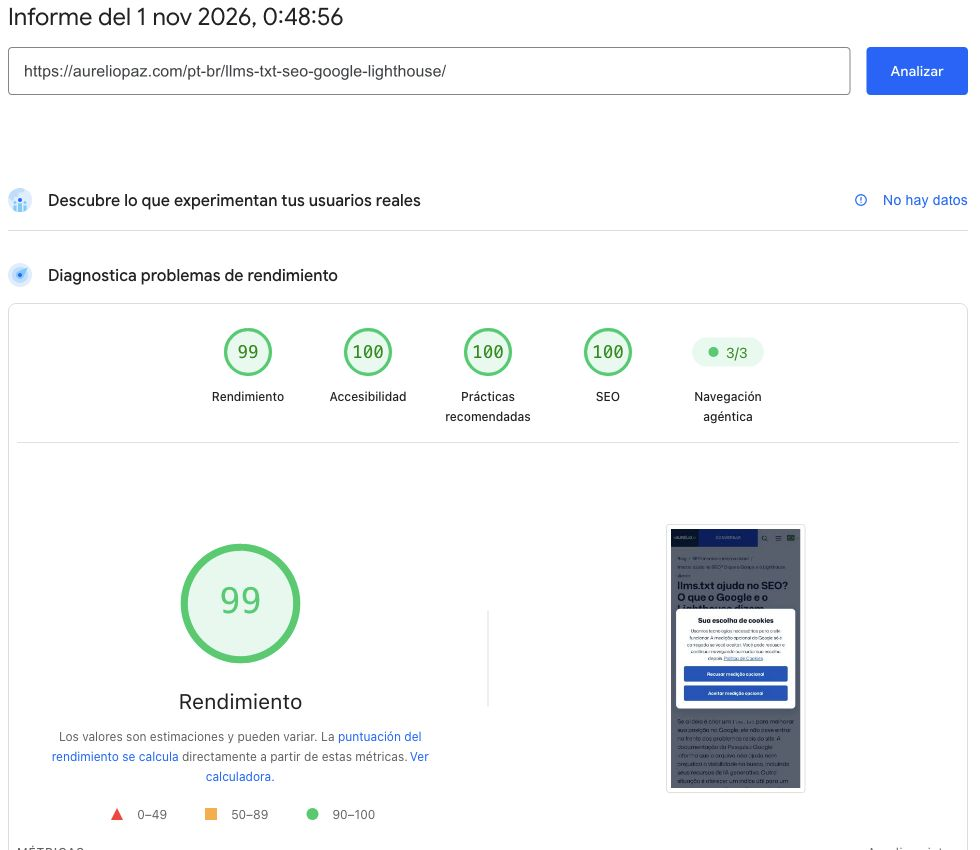
The first screenshot shows the mobile score of 99, three other scores of 100, and no available field data. The PageSpeed interface is preserved in its original Spanish.
This example does not prove that the site is slow. It shows a high score’s limit: 99 cannot fill the gap in real user data. Nor does 0 ms TBT prove that menus, search, and forms will respond well in every situation.
Despite the 99, the report flags render-blocking resources and estimates a saving of 840 ms. That is an estimate, not a measured gain. Inspect the resources, propose a change, and compare before and after. This case records a diagnosis; no site change or improvement was measured.
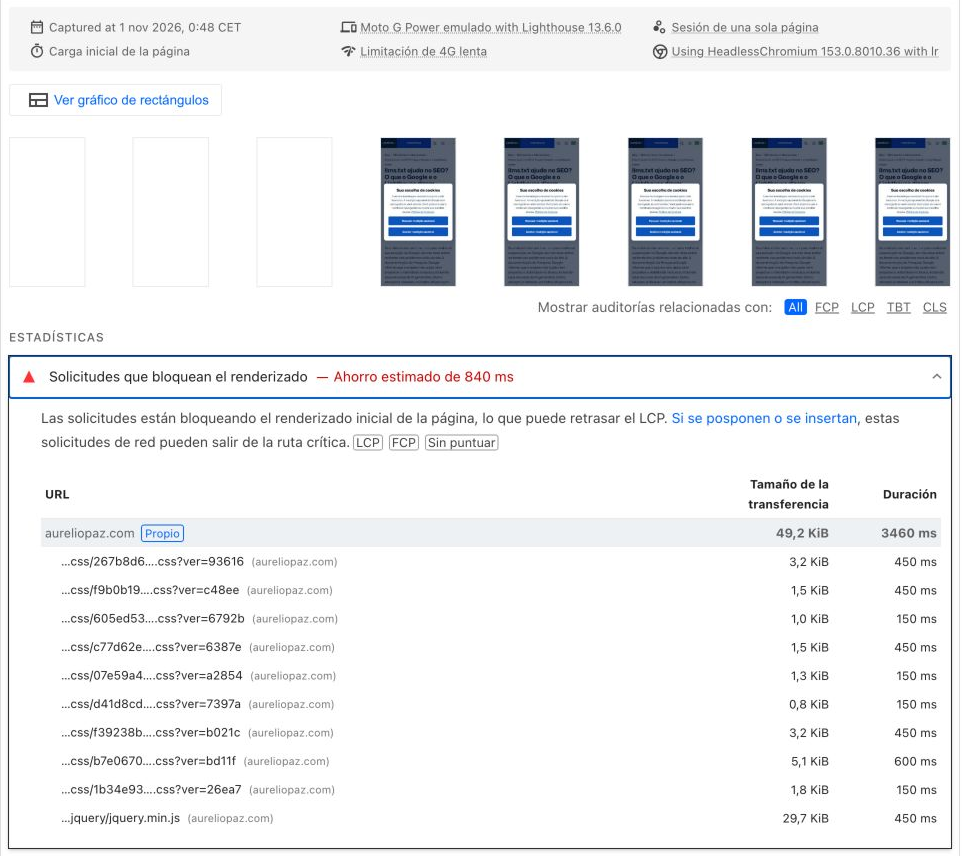
The second screenshot expands that diagnostic. The resource list gives a testable optimization hypothesis, not evidence that the estimated saving has been achieved.
I would record the measurement and test important user journeys before chasing the last point. A complaint needs a URL, action, device, and network to be reproduced. Another run may yield different numbers; this score is not permanent.
The figures and conditions are in the original online PageSpeed report. Check that run before generalizing its result to other visitors.
Choose the next action from the evidence
High lab score, poor field experience: confirm that scope and device type match. Then reproduce the problematic metric under visitor-like conditions. The difference may reveal an experience the controlled run did not capture.
Low lab score, good field experience: inspect the diagnostics and variation between runs. There may still be a useful opportunity for slower devices or networks. Before a large intervention, identify who benefits and which behavior should improve.
No field data: use lab findings to guide investigation and test key tasks. If visitor monitoring is needed, consider your own performance measurement with an appropriate scope and data handling. Until then, keep conclusions tied to what was observed.
Lag after a click: record the flow in Chrome DevTools Performance. Determine whether the delay is before processing, in JavaScript, in presenting the next frame, or in the network response. Investigate the observed stage.
The web.dev explanation of lab and field differences helps interpret these cases without treating controlled conditions as the complete visitor experience.
Turn a complaint into a testable task
Replace “improve PageSpeed” with a reproducible symptom: “On this URL, opening mobile search pauses before the field appears.” Include device, network, sign-in and consent state, and steps to repeat it. Personal data is not needed to describe the issue.
Define the expected evidence: recordings of the same flow before and after, under comparable conditions. Identify the responsible stage and preserve search, keyboard navigation, and integrations. A better score is not useful if the visitor’s task breaks.
Repeat lab tests and record variation rather than choosing only the best score. For field data, note the change date: a rolling window will still mix experiences from before and after the release.
The Chrome DevTools Performance guide explains how to record a flow and locate the delay when it starts after a click.
When to stop chasing the score
Prioritize a fix when you can connect a symptom to a cause and a verifiable visitor benefit. If important tasks work well and a proposal only changes the number, ask for a justification proportionate to its cost and risk.
The same caution applies to SEO. Google says Core Web Vitals are used by its systems, but good results do not guarantee top rankings. Its guidance notes that pursuing a perfect score only for SEO may not be the best use of time.
Google’s page experience guidance helps interpret the role of Core Web Vitals in search without promising positions.
Want to decide which performance issue to investigate on your site? Talk with me on WhatsApp and describe the URL and affected task.
Method note: documentary research and one online run on this production site, with research, writing, and illustration assisted by AI. No conversion gain, ranking improvement, or visitor INP was measured. The cover is an illustration based on photos of the author.